
Services for the
Plastic Container
Industry
Plastic Container
Industry

Latest News
Follow this link to read about relevant industry developments
Services
 The experts at Apex Container Tech Inc. are here to assist you in your current business or with starting a new one
Follow this link to read about relevant industry developments
Services
The experts at Apex Container Tech Inc. are here to assist you in your current business or with starting a new one
SPC FOR BLOW MOLDING
Below is a sample chart with interpretation underneath.
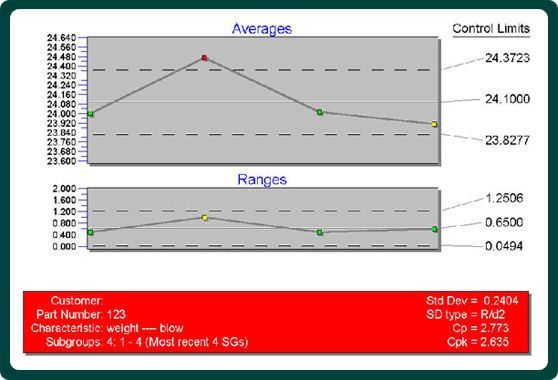
This is a sample of a 4 cavity system. The test parameter is weight.
Looking at the range chart, all cavities are within the control limits and therefore pass.
On the average chart, there is a problem with cavity #2. It is above the control limits and therefore does not pass. Do no be fooled by the relatively high cpk value of 2.635. Because each subgroup consists of only one cavity, the cpk value is usually high. That does not imply that your process is within the control limits. All we are looking for here is to determine if all cavities are statistically the same so that we can take just one cavity as a sample for any subsequent tests. In the case above, reduce the weight on cavity #2 and run the test again
Next month I will show the steps to test if your process is in control.

Blow Molding Package Development
Comprehensive services to develop your package in any blow molding technology
Blow Molding: Reheat
Stretch blow molding is one of the areas our expertise covers. Examine our offerings
Blow Molding: Extrusion
Our expert advice in this area has helped many companies improve their bottom line
Blow Molding: Injection Stretch
Injection stretch blow molding is a complicated process that often requires our expert advice