
Services for the
Plastic Container
Industry
Plastic Container
Industry

Latest News
Follow this link to read about relevant industry developments
Services
 The experts at Apex Container Tech Inc. are here to assist you in your current business or with starting a new one
Follow this link to read about relevant industry developments
Services
The experts at Apex Container Tech Inc. are here to assist you in your current business or with starting a new one
SPC for Blow Molding
Part two
Assuming you have done the initial test on your multi cavity machine and managed to get each cavity within the control limits of all cavities on both the average and the range chart, you are now ready to proceed to the next step.
Our goal will be to make sure that all parts produced will be within the upper and lower specification limit. Statistical tools allow to make a prediction from a limited number of samples. Our target parameter will be weight, the mother of all parameters when it comes to blow molding. I am saying that because so many other parameters are dependent on weight. An additional advantage is that weight can be measured instantly while dimensional checks require the conditioning of the parts at 23º C or 73º F and 50% humidity for two days. (Of course these checks are done a lot sooner to avoid the production of scrap but keep in mind that your customers will do the checks when the parts have shrunk further). Another important parameter is the tail length. Varying tail length will shift the parison program and can lead to all kinds of bottle failures. There are various tests performed in the industry to test the capability of a blow molding process. I have had good success with taking a sample of each cavity every half hour for a total of 6 hours. These data will then be used to establish an initial cpk value. It reflects both machine and material blending performance and includes noise parameters such as humidity and temperature. Once we know the process is capable, we can then take just one randomly collected sample in intervals of 30 min to 2 h to watch the process over time. We will revert to a change in the process only if our data tell us that less than 100% of our production will be in spec. It could be argued to test only one sample per 30 min during this test but I would rather test one sample of each cavity to make sure I do not miss any abnormal behavior.
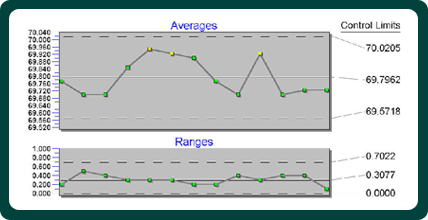
Below is a sample chart, again created with SPC Express:
Assuming you have done the initial test on your multi cavity machine and managed to get each cavity within the control limits of all cavities on both the average and the range chart, you are now ready to proceed to the next step.
Our goal will be to make sure that all parts produced will be within the upper and lower specification limit. Statistical tools allow to make a prediction from a limited number of samples. Our target parameter will be weight, the mother of all parameters when it comes to blow molding. I am saying that because so many other parameters are dependent on weight. An additional advantage is that weight can be measured instantly while dimensional checks require the conditioning of the parts at 23º C or 73º F and 50% humidity for two days. (Of course these checks are done a lot sooner to avoid the production of scrap but keep in mind that your customers will do the checks when the parts have shrunk further). Another important parameter is the tail length. Varying tail length will shift the parison program and can lead to all kinds of bottle failures. There are various tests performed in the industry to test the capability of a blow molding process. I have had good success with taking a sample of each cavity every half hour for a total of 6 hours. These data will then be used to establish an initial cpk value. It reflects both machine and material blending performance and includes noise parameters such as humidity and temperature. Once we know the process is capable, we can then take just one randomly collected sample in intervals of 30 min to 2 h to watch the process over time. We will revert to a change in the process only if our data tell us that less than 100% of our production will be in spec. It could be argued to test only one sample per 30 min during this test but I would rather test one sample of each cavity to make sure I do not miss any abnormal behavior.
Below is a sample chart, again created with SPC Express:
SPC for Blow Molding

Shown are the 13 subgroups of samples that we took over the 6 hour test run. The specification limits are 72 g and 68 g and it is easy to see that we are in excellent control with the control limits far away from the specification limits and all values within the control limits. The high cpk value reflects this.
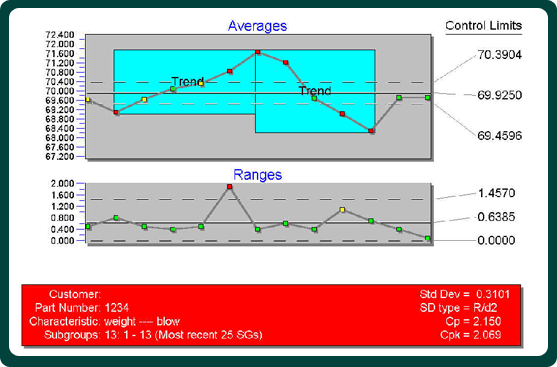
Now let's look at another chart, maybe closer to reality:
SPC for Blow Molding
Please note that all containers are within spec but the process is clearly not in control. Instead it drifts to the upper and lower boundary. The out of control range on subgroup 6 could indicate that there is a problem with one parison or there is a problem with extruder surging, inconsistent material mix or the like. As you can see from this chart, it is not enough to look at the cpk value. This value is high because the process mean is very close to the middle of the specification limits and therefore the calculations pan out to a high value.
Let's look at a similar process with the weights closer to the lower limit:
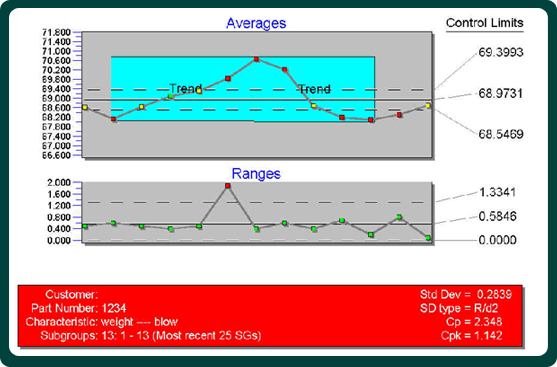 All containers are still within spec and the ranges are very similar. The cpk value is only half of the previous example because the values are now closer to the lower limit.
It becomes apparent from these charts that our initial parameters need to be close to the middle of the specification limits because we have a bigger process window to work with and can produce containers within spec even when our machine capabilities are not 100%.
A number of subgroups where one subgroup has a continuously higher (or lower) mean, can be called a trend. This feature allows QC personnel to alert the operator to a potential problem that could lead to out of spec samples. The operator can then make an adjustment or at least watch the process more closely. In any case, a chart like the two above should lead to an investigation and the underlying problem should be addressed.
Next month we will look at a Design of Experiment to find the cause of the weight fluctuations.
Let's look at a similar process with the weights closer to the lower limit:
All containers are still within spec and the ranges are very similar. The cpk value is only half of the previous example because the values are now closer to the lower limit. It becomes apparent from these charts that our initial parameters need to be close to the middle of the specification limits because we have a bigger process window to work with and can produce containers within spec even when our machine capabilities are not 100%.
A number of subgroups where one subgroup has a continuously higher (or lower) mean, can be called a trend. This feature allows QC personnel to alert the operator to a potential problem that could lead to out of spec samples. The operator can then make an adjustment or at least watch the process more closely. In any case, a chart like the two above should lead to an investigation and the underlying problem should be addressed.
Next month we will look at a Design of Experiment to find the cause of the weight fluctuations.

Blow Molding Package Development
Comprehensive services to develop your package in any blow molding technology
Blow Molding: Reheat
Stretch blow molding is one of the areas our expertise covers. Examine our offerings
Blow Molding: Extrusion
Our expert advice in this area has helped many companies improve their bottom line
Blow Molding: Injection Stretch
Injection stretch blow molding is a complicated process that often requires our expert advice